More and more people are training with power, but what does it really mean? I saw a cool video recently that illustrates power and watts well. A pro track cyclist rode a bike at 700 watts to toast a piece of bread. That 700 watts are the same watts on the bike you are riding.
Power is the rate at which energy is used (energy over time). It is measured in watts. My son recently asked how they measure horsepower. I had to look it up (“A dynamometer places a load on the engine and measures the amount of power that the engine can produce against the load” wikipedia) 1 horsepower is 746 watts. So now think about the outboard motors on boats - depending on the size they can go from 2.5 all the way up over 150!
Power meters on the market measure watts in a variety of ways - in the pedals, crank, hub, one side only, and/or both side. It is critical to know how you ride and how you want to use power before investing $1300 or more. Indoor options are great for winter training (some pros train year round indoors) with either stationary bikes or trainers with power integrated.
If you are training with power then understanding the numbers and readouts is critical. Most computers will give you a variety of numbers during and at the end of your ride. Average power is just what it seems. The average power you have put out over the time of the ride. This includes coasting on a trainer or long warm ups and cool downs.
Normalized power uses an algorithm to account for coasting, intervals etc. to estimate the power you could have sustained for the entire ride. Typically as you might expect it is higher than the average. Training Peaks (TP) software will estimate normalized. TP will also give you a training stress score, a metric developed by Andrew Coggan to measure the relative intensity of the ride. An all out 1 hour ride is 100. Two hours hard is 150. This is a good measurement to look at with regard to recovery. It can also help to set the plan for longer races.
A lot of people who train with power will also use heart rate (HR). I have athletes use their HR monitors while training with power indoors to put together plans for HR ranges for outdoor races. Your heart rate is your bodies response to work. This is a variable that can change based on a number of factors. A higher than normal heart rate might mean your are overtraining or even getting sick. Hence you want to train using heart rate data over time. In addition as you become more fit your zones will change.
You hear functional threshold power a lot when the topic of training with power comes up. This is the measurement of how much power you can sustainably produce over the course of an hour. There are a variety of tests to figure out your functional threshold power - time trial, 20 minute test, ramp test and a couple of others. Some indoor trainers have test built into the software. Probably the most popular is the 20 minute all-out time trial, typically on a steady climb. You will want a good warm up with some high end spins ups to get the legs moving. You then ride for 20 minutes at your max power. Your functional threshold power is 95 percent of your 20-minute power number.
On a lot of the computers you will see kilo-joules. This is a unit of work which pretty closely translates to a kilocalorie or what we in the US call a calorie. Not every calorie burned actually propels you forward on the bike. Most people are only 20-25% efficient which means 75%+ is turned into heat. If we can increase efficiency you can put out more power for the same calorie of work. You should have a better calorie calculation using power meter computers than a regular spin bike. Better yet is to tie HR into the equation. Most gym computers on spin bikes, elliptical machines etc way over estimate the number of calories burned for women. They calibrate off of a 160 pound male! Take these numbers with a GRAIN of salt.
How does cadence play into all of this? Well to increase power output you can either push on the pedal harder or turn the pedal faster. Everyone has a sweet spot. Where they can put out the best power number. It is a cadence range and a road grade range. You want to dial in what is best for you and then either choose all races that fit this profile or start training to effectively and efficiently ride the courses you have signed up for already!
So how do you know if you have ‘good’ numbers?
A watt is a watt, so a higher number is better right? If the guy next to you can ride with an hour at 250 and you can maintain 175 who is faster, better? Well it depends on weight too. Figuring out power/weight ratios are how the pros do it. This calculator will help you.
The higher your power to weight ratio the faster you will go. Ok let’s make it a bit more confusing. Your body composition matters as well. If you have no muscle (higher body fat) you might be light, but you will have less power. So your body composition become important in the equation as well. You might want to lose/gain a few pounds to optimize your power/weight ratio, but make sure you take into account body composition. When most people lose weight they lose body fat and muscle. Focus on maintaining/gaining muscle if you want to lose weight.
What if you aren’t on the chart or are in the fair category? Remember this chart was designed for pro cyclists.
Andrew Coggan posted this chart as an all rounder athlete - one who can perform on a variety of course - more like a triathlete. To use this table:
If all 4 values are around the same point across the chart then you are likely good all around. Most non-elite athletes will fall here.
What if you have a different shape?
Lots of information here, but data can be your friend. It can help you prepare to have the day you want to have. That might be crossing the line with a big smile and feeling good enough to go sightseeing later in the day or standing on top of the podium.
Power is the rate at which energy is used (energy over time). It is measured in watts. My son recently asked how they measure horsepower. I had to look it up (“A dynamometer places a load on the engine and measures the amount of power that the engine can produce against the load” wikipedia) 1 horsepower is 746 watts. So now think about the outboard motors on boats - depending on the size they can go from 2.5 all the way up over 150!
Power meters on the market measure watts in a variety of ways - in the pedals, crank, hub, one side only, and/or both side. It is critical to know how you ride and how you want to use power before investing $1300 or more. Indoor options are great for winter training (some pros train year round indoors) with either stationary bikes or trainers with power integrated.
If you are training with power then understanding the numbers and readouts is critical. Most computers will give you a variety of numbers during and at the end of your ride. Average power is just what it seems. The average power you have put out over the time of the ride. This includes coasting on a trainer or long warm ups and cool downs.
Normalized power uses an algorithm to account for coasting, intervals etc. to estimate the power you could have sustained for the entire ride. Typically as you might expect it is higher than the average. Training Peaks (TP) software will estimate normalized. TP will also give you a training stress score, a metric developed by Andrew Coggan to measure the relative intensity of the ride. An all out 1 hour ride is 100. Two hours hard is 150. This is a good measurement to look at with regard to recovery. It can also help to set the plan for longer races.
A lot of people who train with power will also use heart rate (HR). I have athletes use their HR monitors while training with power indoors to put together plans for HR ranges for outdoor races. Your heart rate is your bodies response to work. This is a variable that can change based on a number of factors. A higher than normal heart rate might mean your are overtraining or even getting sick. Hence you want to train using heart rate data over time. In addition as you become more fit your zones will change.
You hear functional threshold power a lot when the topic of training with power comes up. This is the measurement of how much power you can sustainably produce over the course of an hour. There are a variety of tests to figure out your functional threshold power - time trial, 20 minute test, ramp test and a couple of others. Some indoor trainers have test built into the software. Probably the most popular is the 20 minute all-out time trial, typically on a steady climb. You will want a good warm up with some high end spins ups to get the legs moving. You then ride for 20 minutes at your max power. Your functional threshold power is 95 percent of your 20-minute power number.
On a lot of the computers you will see kilo-joules. This is a unit of work which pretty closely translates to a kilocalorie or what we in the US call a calorie. Not every calorie burned actually propels you forward on the bike. Most people are only 20-25% efficient which means 75%+ is turned into heat. If we can increase efficiency you can put out more power for the same calorie of work. You should have a better calorie calculation using power meter computers than a regular spin bike. Better yet is to tie HR into the equation. Most gym computers on spin bikes, elliptical machines etc way over estimate the number of calories burned for women. They calibrate off of a 160 pound male! Take these numbers with a GRAIN of salt.
How does cadence play into all of this? Well to increase power output you can either push on the pedal harder or turn the pedal faster. Everyone has a sweet spot. Where they can put out the best power number. It is a cadence range and a road grade range. You want to dial in what is best for you and then either choose all races that fit this profile or start training to effectively and efficiently ride the courses you have signed up for already!
So how do you know if you have ‘good’ numbers?
A watt is a watt, so a higher number is better right? If the guy next to you can ride with an hour at 250 and you can maintain 175 who is faster, better? Well it depends on weight too. Figuring out power/weight ratios are how the pros do it. This calculator will help you.
The higher your power to weight ratio the faster you will go. Ok let’s make it a bit more confusing. Your body composition matters as well. If you have no muscle (higher body fat) you might be light, but you will have less power. So your body composition become important in the equation as well. You might want to lose/gain a few pounds to optimize your power/weight ratio, but make sure you take into account body composition. When most people lose weight they lose body fat and muscle. Focus on maintaining/gaining muscle if you want to lose weight.
What if you aren’t on the chart or are in the fair category? Remember this chart was designed for pro cyclists.
Andrew Coggan posted this chart as an all rounder athlete - one who can perform on a variety of course - more like a triathlete. To use this table:
- print a copy
- locate and highlight the peak or maximum power that you can generate for 5 s, 1 min, 5 min, and at functional threshold power, and then connect the values horizontally. If your performance falls between tabled values, just assign them to the nearest ranking.
If all 4 values are around the same point across the chart then you are likely good all around. Most non-elite athletes will fall here.
What if you have a different shape?
- “(\) Distinctly down-sloping plot (esp. between 1 min and 5 min): this pattern would be characteristic of an excellent sprinter/"fast twitcher", i.e., an athlete whose naturally abilities are skewed towards success in short duration, high power events. Since aerobic ability is quite trainable, such an individual may be able to turn themselves into more of an "all-rounder" by appropriately-focused training - however, if they have already been training hard for many years, they may always still be better at anaerobic vs. aerobic efforts. If so, focusing on events that favor these abilities (e.g., track racing, criteriums) may result in the most success.
- (/) Distinctly upsloping plot (again, esp. between 1 min and 5 min, but also somewhat between 5 min and functional threshold power): the classical time-trialist pattern, i.e., weak in neuromuscular power and anaerobic capacity, but with a relatively high aerobic power and especially a high lactate threshold. While such athletes may improve their performance by working on their weaknesses, this may not necessarily be true if it results in a decline in their strength, which is sustainable power.
- (^) Sharply inverted-V pattern: an athlete characterized by both relatively high anaerobic capacity and aerobic ability, and thus well-suited for events such as the pursuit. Alternatively, a potential "all-rounder" who simply hasn't focused on raising their lactate threshold to its highest possible level.
- (V) Sharp V-pattern: an unlikely combination, given the expected inverse relationship between neuromuscular power and lactate threshold, and the positive relationship expected between VO2max and lactate threshold. Should such a pattern be observed, care should be taken to assure that the values being used are truly representative of the athlete's abilities, and to be sure that the pattern isn't simply being misinterpreted (i.e., considering a generally horizontal or "w" pattern to be a "V"). The standards are based on the performance capacities of young adults, and thus do not account for the effects of aging (or development). The possibility of developing age-specific standards was considered but rejected due to the lack of sufficient direct data as well as the complexity of attempting any corrections based on known physiological changes. For example, while VO2max declines by ~0.5 mL per min per kg per year (~0.35 mL per min per kg per year in women) starting at around age 30, muscle strength and power are generally well-maintained until around age 50, then begin to decline somewhat more rapidly thereafter. Such observations imply that, for maximum accuracy, different age-based correction factors might need to be applied to the different columns. It is unlikely, however, that these differential changes with age are sufficient to significantly alter a rider's "profile", and it is suggested that the tables simply be applied "as is" regardless of a rider's age.” (from http://home.trainingpeaks.com/blog/article/power-profiling)
Lots of information here, but data can be your friend. It can help you prepare to have the day you want to have. That might be crossing the line with a big smile and feeling good enough to go sightseeing later in the day or standing on top of the podium.
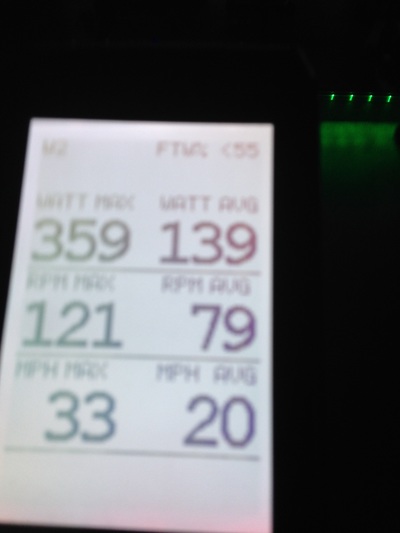
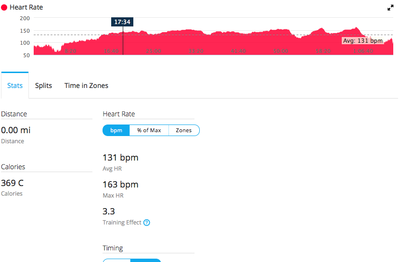
Above are data from a ride at Vent on the IC7 bikes with power. Unfortunately I can't track power over time and capture that data. I can get the max (yes high) and the average (not so high). The chart on the right is my heart rate. I know I peaked the watts at the end of the ride when my heart rate peaked. Training Peaks gave my and Intensity Factor (IF) score of .75 - bottom end of endurance base. Due to my lower average heart rate. The TSS was 70 - again low - recovery level! Yet Garmin Connect gives me a 3.3 which is improving. So what does this tell me? I need to get stronger. My muscular strength needs to catch up to my cardio strength. Working on it! My goal in rides now is to watch my power over the ride and not drop off in recovery, but maintain a solid power output. How about you? What are your power goals?
Do. Believe. Achieve.
Do. Believe. Achieve.


 RSS Feed